WEWoS is under development (version 0.1.0). These pages describe a test version.
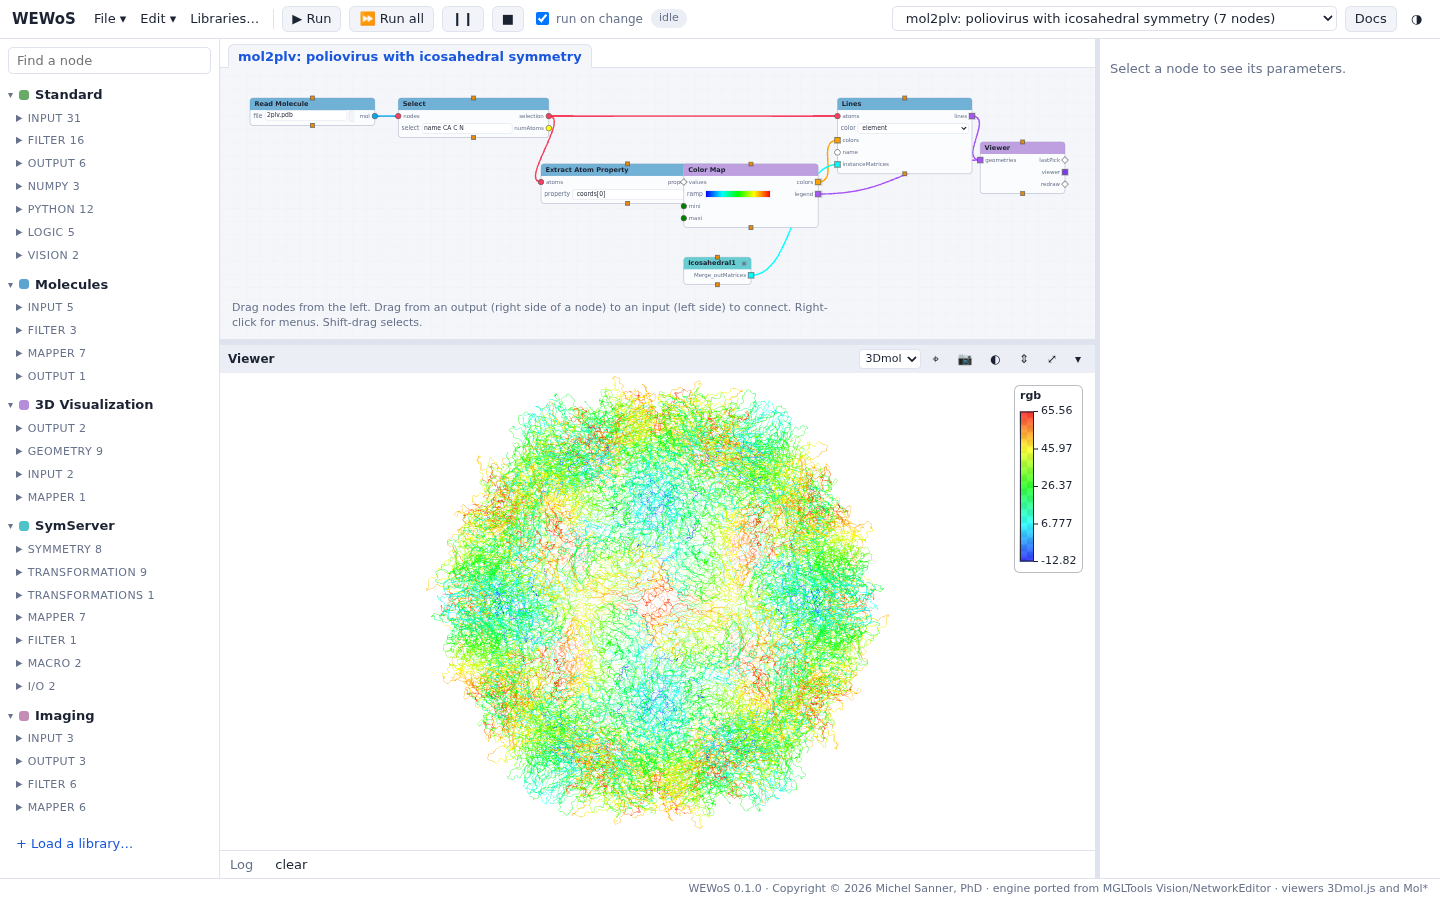
WEWoS brings Vision, the visual programming environment of MGLTools, to the web browser: build programs by connecting nodes, and see molecules, surfaces, volumes, images and plots as they run.
A program is a network of nodes. Each node runs a small Python function; connections carry data from a node’s outputs to another node’s inputs, and when a node gets new data it runs and sends its results on. Inputs can have widgets (a dial, a number, a file name, a menu), so you can explore a computation by turning a dial and watching the result.
- Server: a Python 3 port of the NetworkEditor/Vision engine runs on a local server.
- Browser: draws the network editor and the 3D viewers, which replace DejaVu. Each viewer draws with 3Dmol.js or Mol* (ambient occlusion, shadows, depth of field, illumination).
- Libraries: Standard, 3D Visualization, Molecules (MolKit2, ProDy, MSMS), Volume, Imaging, MatPlotLib and SymServer, loaded on demand as in Vision.
- Vision networks: saved Vision networks (
*_net.py) can be imported; the file is converted, not executed.
License
WEWoS is distributed under the Sannerlab MIT-like Source-Available License. Its MSMS node library uses MSMS, which is free for non-commercial use only; see the MSMS license.
History
Vision began as ViPEr, a Visual Programming Environment for Python, written by Michel Sanner, Daniel Stoffler and Arthur Olson in the Molecular Graphics Lab of The Scripps Research Institute. It was presented at the 10th International Python Conference in February 2002, where it received the best paper award, and was later renamed Vision and distributed with MGLTools. WEWoS keeps the design the paper describes; the network of the paper’s figure 1 runs in WEWoS as the example ViPEr paper figure 1.
- Sanner, M. F.; Stoffler, D.; Olson, A. J. ViPEr, a Visual Programming Environment for Python. Proceedings of the 10th International Python Conference, 2002. Paper